
AI Agent Observability: How to Trace, Debug and Cost a Production Run
A log line that says the run failed cannot tell you which tool ran, what it cost, or where the chain broke. Here is the OpenTelemetry instrumentation, MCP span attributes and cost math that can.

Day 22 covered stateless versus stateful agent infrastructure. Day 23 covered the timeouts, retries, validation and fallbacks that make a run survive a bad network or a flaky tool. Both of those posts assumed you could tell whether any of it was working. This one is about that assumption.
[ERROR] agent run failed is not an observation. It is an admission that you were not watching. It cannot tell you which tool ran, what arguments went out, what came back, how long each step took, whether the model retried, or what the run cost. A production agent has to answer all of that for one specific run, on demand, days after the fact, and a flat log stream was never built to do it.
The reason it fails specifically for agents is structural. A normal request handler executes a straight line of code and a log stream is a reasonable approximation of that line. An agent branches on a model's decision, calls tools in an order nobody wrote down, retries when a call fails, and sometimes calls itself again with a revised plan. That shape is a tree, not a timeline, and the only telemetry primitive that preserves a tree is a set of nested spans sharing one trace ID. This post builds that: a working OpenTelemetry instrumentation for an agent loop, the real gen_ai.* attribute names and their current stability, what changes when a tool call crosses an MCP server boundary, how to turn recorded token usage into a per-tenant cost figure, a sampling policy that never throws away your failures, redaction that runs whether or not the application code remembered to redact, and the metric cardinality mistakes that turn a reasonable observability bill into an incident of its own.
The unit of observability is the span, not the line
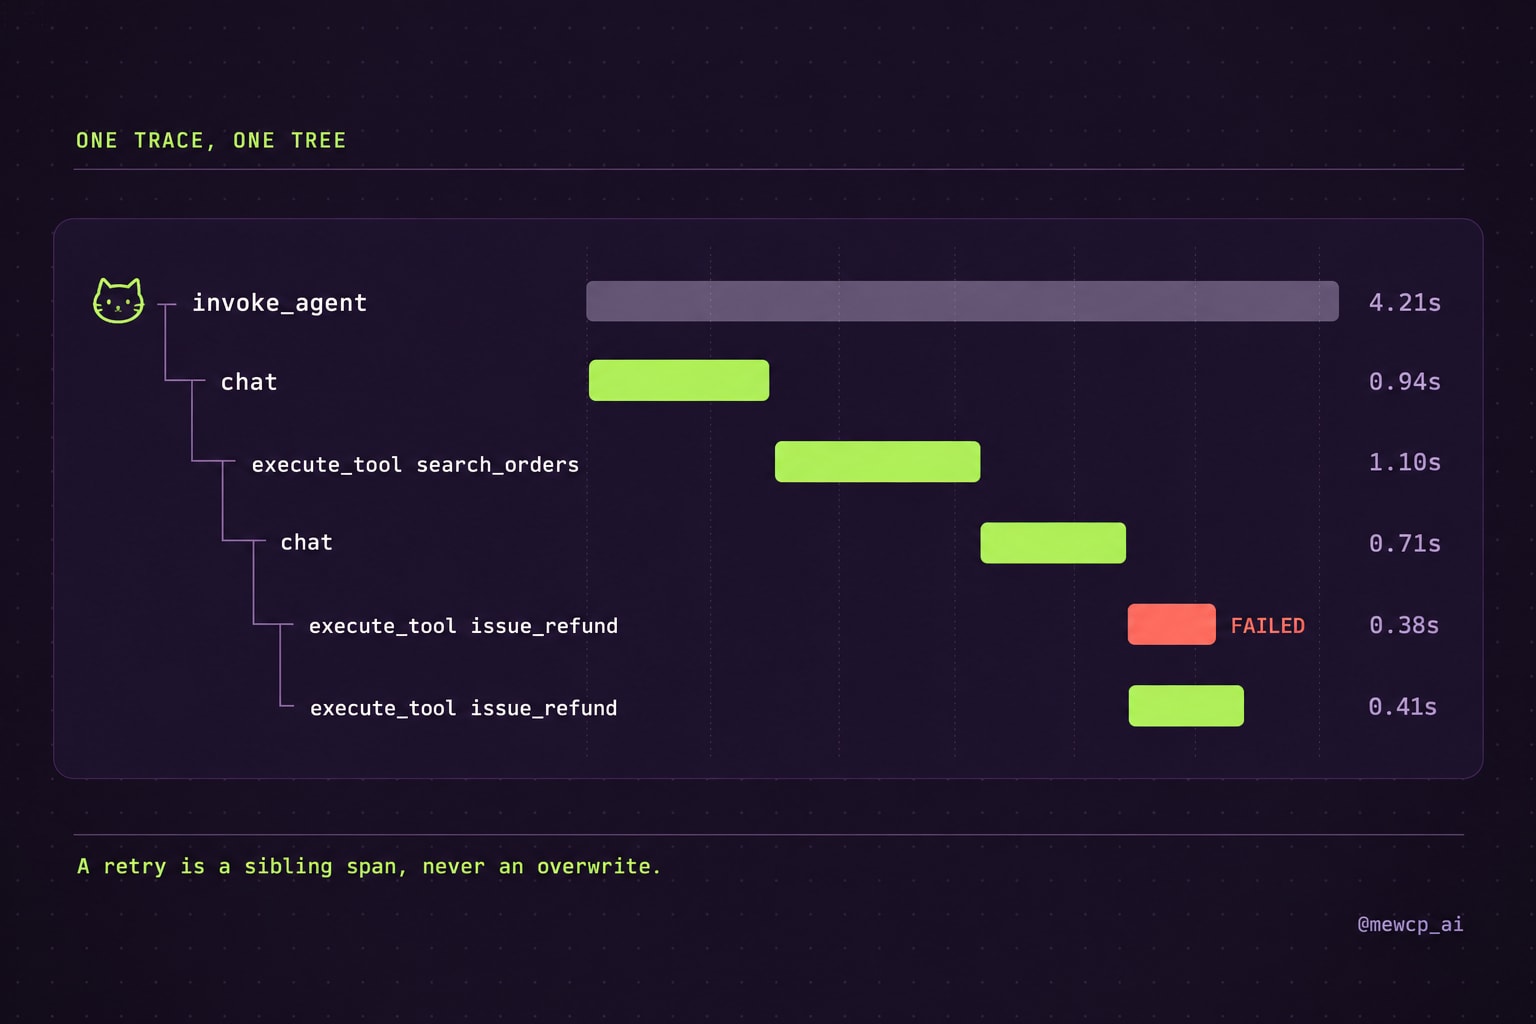
A trace is one run, identified by one trace ID. A span is one bounded piece of work inside that run, with a start time, an end time, a set of key-value attributes, and a pointer to its parent span. Nest the spans the way the work actually nests and the tree draws itself: an invoke_agent span wraps the whole run, each model call is a chat span inside it, each tool call is an execute_tool span inside the chat that requested it, and a retried tool call is a second sibling span, not an overwrite of the first.
That last property is the one flat logging cannot give you. A log line gets appended and the previous line stays exactly as wrong as it was. A span tree keeps the failed attempt and the successful retry as two distinct nodes with the same tool name, so you can see the tree exactly as it executed: what failed, what was tried next, and how long the recovery took.
OpenTelemetry's GenAI semantic conventions define this shape for language model and agent workloads specifically, rather than leaving every team to invent its own span names and attribute keys. They live in their own repository now, open-telemetry/semantic-conventions-genai, separate from the core semantic conventions, and every page of that spec currently carries a Development stability badge. That is not a caveat to skim past. It means attribute names have moved before (gen_ai.system was renamed to gen_ai.provider.name after wide adoption) and can move again. The chat and token-usage attributes are stable enough in practice to build real dashboards on. The agent- and tool-orchestration attributes are newer and more likely to shift. Pin your instrumentation library versions, read the changelog before you upgrade, and do not let a vendor's dashboard hardcode an attribute name you cannot easily change later.
Instrumenting the agent loop
Here is a working agent loop instrumented with the real span names and attribute keys from the spec. It uses the standard opentelemetry-sdk and opentelemetry-exporter-otlp packages, nothing invented.
# pip install opentelemetry-sdk opentelemetry-exporter-otlp-proto-grpc
import time
import uuid

from opentelemetry import trace
from opentelemetry.exporter.otlp.proto.grpc.trace_exporter import OTLPSpanExporter
from opentelemetry.sdk.resources import Resource
from opentelemetry.sdk.trace import TracerProvider
from opentelemetry.sdk.trace.export import BatchSpanProcessor

resource = Resource.create({"service.name": "support-agent"})
provider = TracerProvider(resource=resource)
provider.add_span_processor(BatchSpanProcessor(OTLPSpanExporter()))
trace.set_tracer_provider(provider)

tracer = trace.get_tracer("support-agent")


def run_agent(user_message: str, tenant_id: str, agent_name: str = "support-router") -> str:
    conversation_id = str(uuid.uuid4())

    # invoke_agent: one span for the whole run. Span name follows the spec's
    # pattern "invoke_agent {gen_ai.agent.name}".
    with tracer.start_as_current_span(f"invoke_agent {agent_name}") as agent_span:
        agent_span.set_attribute("gen_ai.operation.name", "invoke_agent")
        agent_span.set_attribute("gen_ai.provider.name", "anthropic")
        agent_span.set_attribute("gen_ai.agent.name", agent_name)
        agent_span.set_attribute("gen_ai.conversation.id", conversation_id)
        # Custom attribute in your own namespace, never in gen_ai.* -
        # the spec does not define a tenant concept and never will.
        agent_span.set_attribute("mewcp.tenant.id", tenant_id)

        messages = [{"role": "user", "content": user_message}]
        final_text = None

        for _ in range(MAX_ITERATIONS := 4):
            response = call_model(messages)
            if response.tool_calls:
                for call in response.tool_calls:
                    result = execute_tool(call)
                    messages.append(tool_result_message(call, result))
                continue
            final_text = response.text
            break

        agent_span.set_attribute("gen_ai.response.finish_reasons", ["stop"])
        return final_text or "I could not complete this in time. A human will follow up."


def call_model(messages: list[dict]) -> "ModelResponse":
    model = "claude-sonnet-5"
    # chat: span name follows "{gen_ai.operation.name} {gen_ai.request.model}".
    with tracer.start_as_current_span(f"chat {model}") as span:
        span.set_attribute("gen_ai.operation.name", "chat")
        span.set_attribute("gen_ai.provider.name", "anthropic")
        span.set_attribute("gen_ai.request.model", model)
        try:
            response = anthropic_client.messages.create(model=model, messages=messages, tools=TOOLS)
        except Exception as exc:
            span.set_attribute("error.type", type(exc).__name__)
            span.record_exception(exc)
            raise
        span.set_attribute("gen_ai.response.model", response.model)
        span.set_attribute("gen_ai.usage.input_tokens", response.usage.input_tokens)
        span.set_attribute("gen_ai.usage.output_tokens", response.usage.output_tokens)
        return to_model_response(response)


def execute_tool(call: "ToolCall") -> str:
    # execute_tool: span name follows "execute_tool {gen_ai.tool.name}".
    with tracer.start_as_current_span(f"execute_tool {call.name}") as span:
        span.set_attribute("gen_ai.operation.name", "execute_tool")
        span.set_attribute("gen_ai.tool.name", call.name)
        span.set_attribute("gen_ai.tool.call.id", call.id)
        try:
            result = tool_registry[call.name](**call.arguments)
        except ToolError as exc:
            # A failed tool call is a completed span, not a missing one.
            # The retry that follows is a sibling span, never a mutation
            # of this one.
            span.set_attribute("error.type", type(exc).__name__)
            span.record_exception(exc)
            raise
        return result
Three details in that code carry the real teaching, not the boilerplate around them.
The span names are not free text. The spec's naming pattern (invoke_agent {agent name}, {operation} {model}, execute_tool {tool name}) exists so a trace backend can group and search spans by name without you inventing a convention per team. Get the pattern wrong and every dashboard built against the spec's assumptions breaks quietly.
A failed tool call still produces a complete span with error.type set on it, and the retry is a new call to execute_tool with the same tool name, which becomes a sibling in the tree. Nobody overwrites anybody. Reconstructing "it tried issue_refund, that failed, it tried again, that worked" is then a tree walk, not a guess based on timestamps.
mewcp.tenant.id deliberately does not live under gen_ai.*. The spec's own guidance is that custom, product-specific concepts belong in your own attribute namespace. Squatting on gen_ai. for something the spec does not define is how your dashboards break the day the working group ships an attribute with the name you already used for something else.
The gen_ai.* attributes that actually exist today
This is the current attribute set from the GenAI semantic conventions, current as of the 2026 revision of semantic-conventions-genai. Requirement level is the spec's own vocabulary: Required attributes must be set, Conditionally Required must be set when the condition holds, Recommended should be set when cheap to get, Opt-In carries request or response content and is off by default because it is expensive and sensitive.
| Attribute | Requirement | Notes |
|---|---|---|
gen_ai.operation.name | Required | chat, execute_tool, invoke_agent, create_agent, embeddings, retrieval, invoke_workflow, plan, and several memory operations |
gen_ai.provider.name | Required | e.g. anthropic, openai, aws.bedrock. Replaces the now-deprecated gen_ai.system |
error.type | Conditionally Required | Set only when the span records a failure |
gen_ai.request.model | Conditionally Required | The model requested, when known |
gen_ai.conversation.id | Conditionally Required | When your framework has one readily available |
gen_ai.usage.input_tokens / gen_ai.usage.output_tokens | Recommended | Replace the deprecated prompt_tokens / completion_tokens names |
gen_ai.response.model | Recommended | The model that actually served the request, which can differ from the one requested |
gen_ai.response.finish_reasons | Recommended | Array; why generation stopped |
gen_ai.request.temperature, max_tokens | Recommended | Sampling parameters, when set |
gen_ai.agent.id, gen_ai.agent.name | Conditionally Required (agent spans) | On create_agent and invoke_agent |
gen_ai.tool.name, gen_ai.tool.call.id | Recommended (tool spans) | On execute_tool |
gen_ai.input.messages, gen_ai.output.messages | Opt-In | Full message content, off by default |
gen_ai.system_instructions, gen_ai.tool.definitions | Opt-In | System prompt and tool schema content |
Do not turn the opt-in attributes on by default. They carry full request and response text, which means every prompt injection payload, every customer's PII and every internal system prompt you did not mean to publish ends up in your trace backend the moment you flip that switch. Turn them on selectively, for a sampled subset of traces, behind the redaction step covered later in this post.
Crossing the MCP boundary without losing the tree
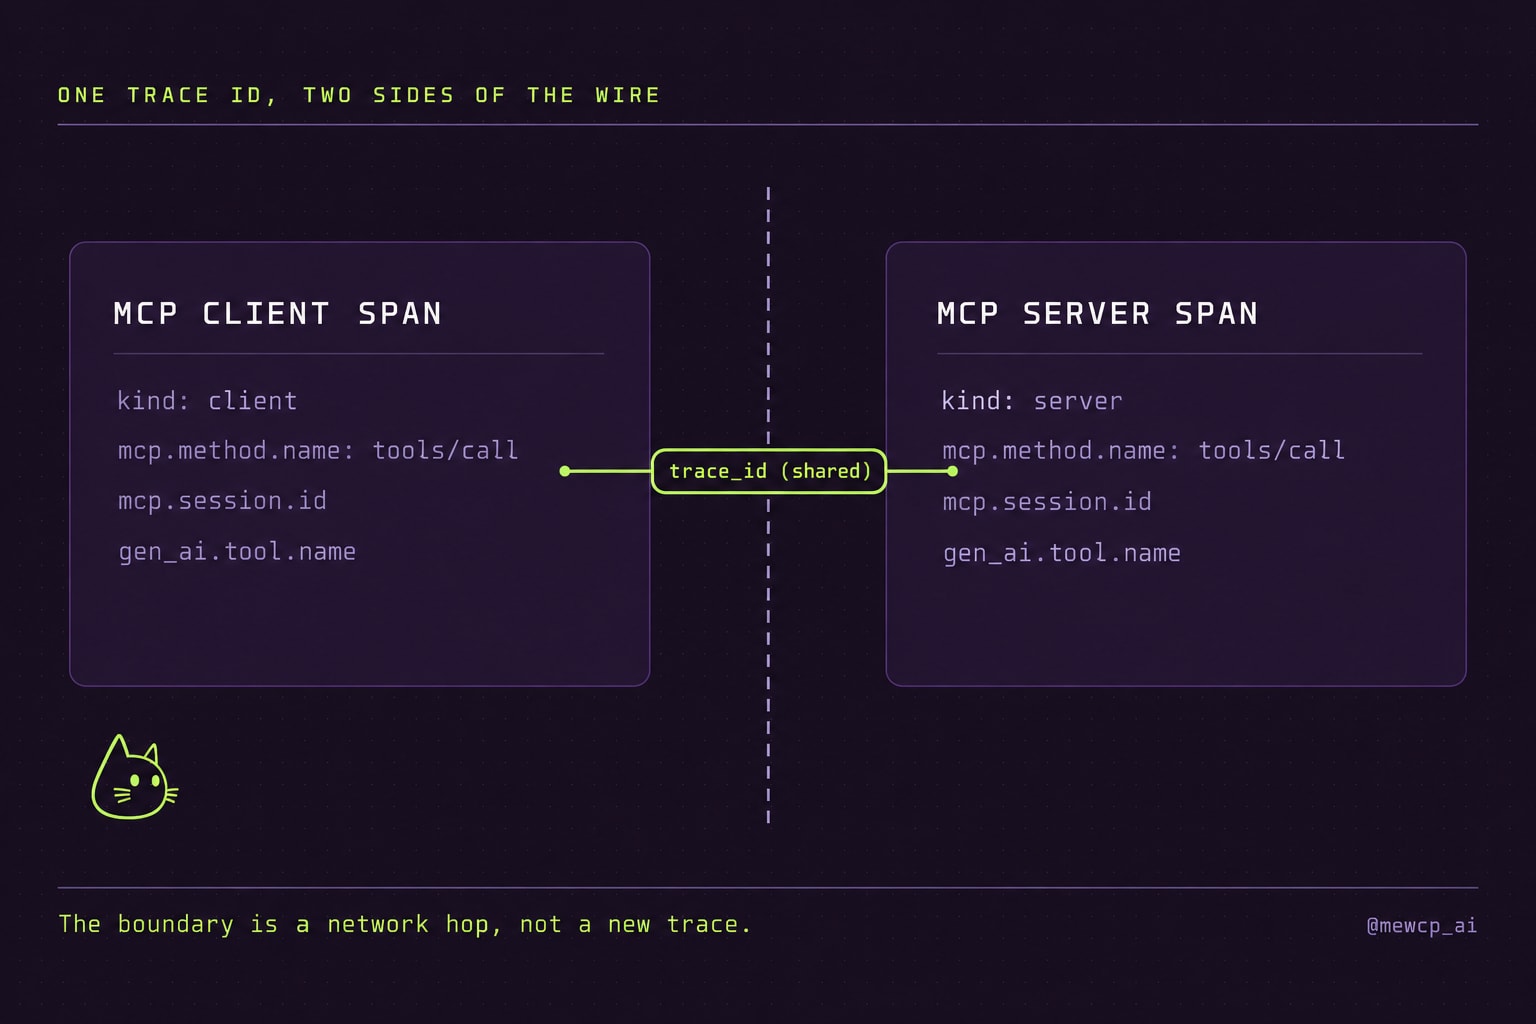
Everything above covers a tool call your agent process executes directly. The moment the tool lives behind an MCP server instead, that single execute_tool span becomes two spans on two sides of a network boundary, and if you do nothing they end up in two different traces.
The fix is the same one distributed tracing has used for a decade: propagate the W3C trace context header across the boundary so both sides record spans under the same trace ID. MCP's own semantic conventions then add attributes specific to the protocol, layered on top of the same execute_tool operation rather than replacing it.
On the client side, the span that calls out is a CLIENT span carrying both the gen_ai.tool.* attributes and the MCP-specific ones:
from opentelemetry.propagate import inject

def call_mcp_tool(server_masked_id: str, tool_name: str, args: dict, session_id: str) -> dict:
    with tracer.start_as_current_span(f"tools/call {tool_name}", kind=trace.SpanKind.CLIENT) as span:
        span.set_attribute("gen_ai.operation.name", "execute_tool")
        span.set_attribute("gen_ai.tool.name", tool_name)
        span.set_attribute("mcp.method.name", "tools/call")
        span.set_attribute("mcp.session.id", session_id)
        span.set_attribute("mcp.protocol.version", "2025-06-18")

        headers = {}
        inject(headers)  # writes traceparent, so the server picks up this trace ID
        response = http_client.post(
            f"https://gateway.mewcp.com/personal/mcp",
            json={"server_maskedId": server_masked_id, "tool_name": tool_name, "args": args},
            headers=headers,
        )
        if response.status_code >= 400:
            span.set_attribute("error.type", "mcp_tool_error")
            span.set_attribute("rpc.response.status_code", response.status_code)
        return response.json()
On the server side, the MCP server extracts that same context before it starts its own span, so the two spans nest under one trace instead of starting a new one:
from opentelemetry.propagate import extract

def handle_tools_call(request_headers: dict, method_name: str, tool_name: str, session_id: str):
    ctx = extract(request_headers)
    with tracer.start_as_current_span(
        f"tools/call {tool_name}", context=ctx, kind=trace.SpanKind.SERVER
    ) as span:
        span.set_attribute("mcp.method.name", method_name)
        span.set_attribute("mcp.session.id", session_id)
        span.set_attribute("gen_ai.tool.name", tool_name)
        # ... resolve the credential server-side and call the upstream API ...
The MCP-specific attributes worth knowing: mcp.method.name is required and takes well-known values like initialize, tools/call, tools/list, resources/read and prompts/get; mcp.session.id and mcp.protocol.version are recommended and let you filter a trace backend down to one client session; mcp.resource.uri is conditionally required for resource operations; jsonrpc.request.id ties the request to its JSON-RPC envelope. Like the rest of the GenAI conventions, these are Development status, though the underlying network.* attributes they build on are already stable.
This is the exact seam a hosted MCP gateway sits on. A client only ever sees one gateway URL and four tools (search, get_schema, list_accounts, call_tool), and every call_tool invocation is itself an MCP boundary crossing into whichever server actually owns the tool. If your platform fans requests out to dozens of connected servers, the trace context has to survive that fan-out or you lose the one property that made tracing worth doing: one trace ID, one run, no matter how many servers it touched.
Turning span attributes into a number your finance team believes
The attributes you are already recording are enough to answer "what did this cost," provided you attach two things nothing in the spec gives you for free: a price table and a tenant identifier.
from collections import defaultdict
from opentelemetry.sdk.trace import ReadableSpan
from opentelemetry.sdk.trace.export import SpanExporter, SpanExportResult

# Illustrative only. Pull current numbers from your provider's pricing page
# before this feeds a real invoice - token prices change without notice.
PRICE_PER_MILLION_TOKENS = {
    "claude-sonnet-5": {"input": 3.00, "output": 15.00},
    "gpt-4o": {"input": 2.50, "output": 10.00},
}


class CostAttributionExporter(SpanExporter):
    """Wraps a real exporter; attributes token cost to a tenant on export."""

    def __init__(self, wrapped: SpanExporter, cost_sink) -> None:
        self.wrapped = wrapped
        self.cost_sink = cost_sink

    def export(self, spans: list[ReadableSpan]) -> SpanExportResult:
        by_tenant = defaultdict(float)
        for span in spans:
            attrs = span.attributes or {}
            if attrs.get("gen_ai.operation.name") != "chat":
                continue
            model = attrs.get("gen_ai.response.model") or attrs.get("gen_ai.request.model")
            prices = PRICE_PER_MILLION_TOKENS.get(model)
            tenant_id = attrs.get("mewcp.tenant.id")
            if not prices or not tenant_id:
                continue
            input_tokens = attrs.get("gen_ai.usage.input_tokens", 0)
            output_tokens = attrs.get("gen_ai.usage.output_tokens", 0)
            cost = (input_tokens / 1_000_000) * prices["input"] + (output_tokens / 1_000_000) * prices["output"]
            by_tenant[tenant_id] += cost

        for tenant_id, cost in by_tenant.items():
            self.cost_sink.increment(tenant_id, cost)

        return self.wrapped.export(spans)

    def shutdown(self) -> None:
        self.wrapped.shutdown()
Wrap your real OTLP exporter in this and register the wrapped version with BatchSpanProcessor instead of the raw one, and every batch of exported spans also increments a per-tenant cost counter. Two things make this trustworthy rather than approximate. It reads gen_ai.usage.input_tokens and gen_ai.usage.output_tokens, the actual counts the provider returned, never an estimate from prompt length. And it keys on mewcp.tenant.id, the same custom attribute set once on the invoke_agent span at the top of the run, not on something re-derived per tool call where it could drift. If your agent runs behind a shared gateway serving many tenants, that tenant identifier has to come from your own authenticated request context and travel down through every child span, exactly the way user identity has to in the credential work from Day 19 and Day 20.
Sampling that never discards a failure
Random, head-based sampling decides whether to keep a trace before the run has finished, which means before it knows whether the run failed. Sample 10 percent and you throw away roughly 90 percent of your incidents along with 90 percent of your healthy traffic. For an agent that already runs longer and branches more than a typical request, that is close to sampling out the only traces you would have wanted.
Tail-based sampling waits until a trace completes, then decides. The OpenTelemetry Collector's tail_sampling processor (shipped in the contrib distribution, not core) does this with an ordered list of policies:
processors:
  tail_sampling:
    decision_wait: 60s        # must exceed your longest expected agent run
    num_traces: 50000
    policies:
      - name: keep-all-errors
        type: status_code
        status_code:
          status_codes: [ERROR]
      - name: keep-slow-runs
        type: latency
        latency:
          threshold_ms: 8000   # your agent's latency budget
      - name: keep-a-sample-of-the-rest
        type: probabilistic
        probabilistic:
          sampling_percentage: 10

exporters:
  otlp:
    endpoint: your-backend:4317

service:
  pipelines:
    traces:
      receivers: [otlp]
      processors: [tail_sampling]
      exporters: [otlp]
Policies are evaluated in order and the first match wins for a given trace, so every trace with an ERROR span is kept regardless of the probabilistic policy beneath it, every trace slower than your latency budget is kept, and everything else is thinned to a manageable volume. Same trace volume you were paying to store before, all of your incidents included.
The parameter worth reading twice is decision_wait. The collector holds every span for a trace in memory until this timer expires, then makes one sampling decision for the whole trace. Set it shorter than your agent's actual run time and you will cut the decision off before a long-running invoke_agent span closes, sampling out failures that simply took longer than the timer to surface. Measure your agent's real tail latency first, then set decision_wait comfortably past it, and budget the collector's memory for holding num_traces complete traces at once rather than single spans.
Redaction has to happen even when the application forgot
Application-level defenses (a Secret type that refuses to serialize, a regex on the way into your logger) are worth having and they only work when every call site remembers to use them. The failure that actually reaches a trace backend is the one nobody anticipated: a provider error body that echoes a request header, a tool result that happens to contain a customer's SSN, an opt-in gen_ai.input.messages attribute someone turned on for debugging and forgot to turn back off.
Pipeline-level redaction is the backstop that runs regardless of what the application did. The Collector's redaction processor, also in the contrib distribution, works from an allow list plus a set of value patterns to mask:
processors:
  redaction:
    allow_all_keys: false
    allowed_keys:
      - gen_ai.operation.name
      - gen_ai.provider.name
      - gen_ai.request.model
      - gen_ai.response.model
      - gen_ai.usage.input_tokens
      - gen_ai.usage.output_tokens
      - gen_ai.tool.name
      - gen_ai.tool.call.id
      - mcp.method.name
      - mcp.session.id
      - mewcp.tenant.id
      - error.type
    blocked_values:
      - "(?i)bearer\\s+[a-z0-9._-]{8,}"          # bearer tokens
      - "[0-9]{3}-[0-9]{2}-[0-9]{4}"              # SSN-shaped strings
      - "4[0-9]{12}(?:[0-9]{3})?"                 # card-number-shaped strings
    hash_function: sha3
    summary: debug
With allow_all_keys: false, any attribute not on allowed_keys is dropped entirely rather than passed through and hoped to be safe, which is the correct default for a pipeline that will eventually carry opt-in message content whether you meant to enable it today or not. blocked_values catches secret- and PII-shaped strings inside the attributes you do allow through, and summary: debug keeps a record of what got redacted so an incident review can see that redaction fired, without keeping the value it redacted.
Treat this as the second layer, not the only one. It only catches the shapes you thought to write a pattern for, exactly like the application-side regex it backstops. The two together, a type that will not print plus a pipeline that will not forward, catch most of what either one misses alone.
The metric cardinality trap
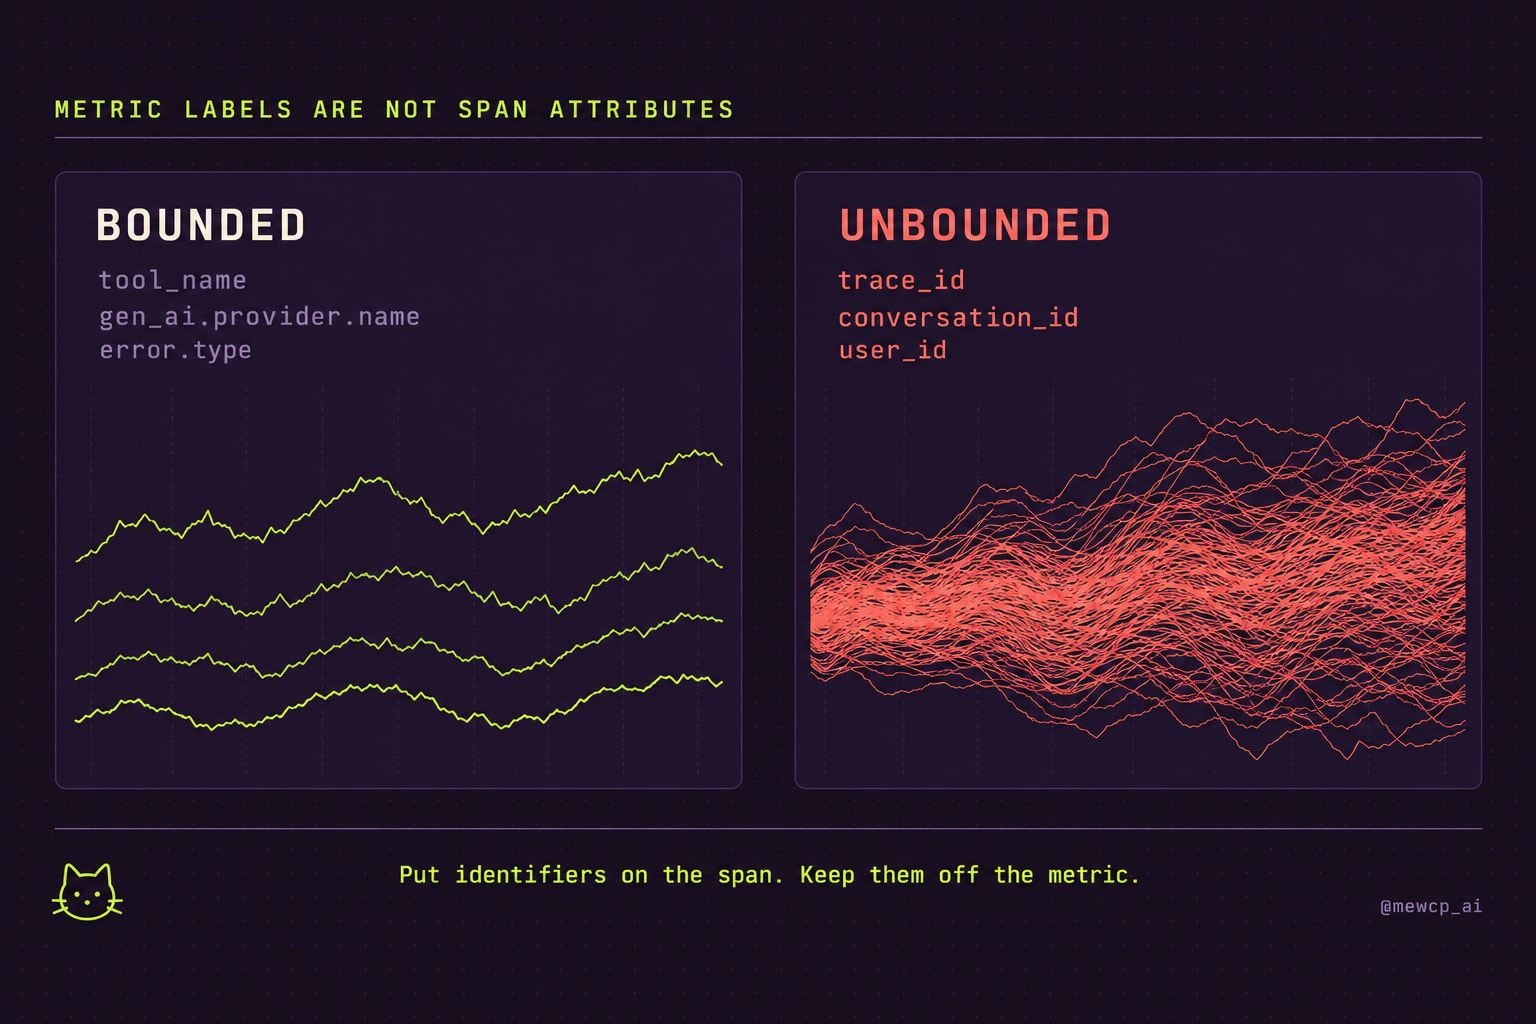
Spans can carry high-cardinality attributes cheaply, because a trace backend stores and indexes spans differently from how a metrics backend stores time series. A metric is not a span. Every unique combination of label values on a metric creates a new, permanently tracked time series, and that is where an otherwise sensible tracing setup produces a shocking bill from an entirely different signal.
The trap is specific and easy to walk into with an agent, because agent telemetry is full of naturally high-cardinality identifiers: trace_id, conversation_id, tool_call.id, user_id. Put any of those on a metric label and the number of time series grows without bound as your traffic grows, because each one is unique by design.
# Wrong: trace_id and user_id are unique per event. Every single agent run
# creates brand new time series that live in your metrics backend forever.
tool_duration.record(
    duration_ms,
    {"tool_name": call.name, "trace_id": trace_id, "user_id": user_id},
)

# Right: bounded, reusable label values. High cardinality context goes on
# the span, not the metric.
tool_duration.record(
    duration_ms,
    {"tool_name": call.name, "gen_ai.provider.name": "anthropic", "error.type": error_type or "none"},
)tool_name, provider, model and error type are bounded sets that repeat across runs, which is exactly what a metric label should be. trace_id and user_id belong on the span where they already live, and if you need to jump from a metric spike to the specific trace that caused it, use exemplars: most modern metrics SDKs attach a sampled trace ID to a histogram bucket without turning that trace ID into a permanent label. That gives you the click-through from "p99 latency spiked" to "here is the trace" without multiplying your time series count by every user who ever called the agent.
The same trap shows up one level up, in dashboards built directly on span attributes rather than dedicated metrics: a query that groups by gen_ai.tool.call.id or gen_ai.conversation.id in a metrics-style backend produces the identical explosion, because the backend does not know the difference between a label you meant to bound and an identifier you happened to have handy.
The AI Agent Observability Checklist
- One trace ID per run, with
invoke_agentas the root span wrapping nestedchatandexecute_toolchildren - Span names follow the spec's pattern:
invoke_agent {agent},{operation} {model},execute_tool {tool} - Retries are recorded as sibling spans with the same tool name, never as an overwrite of the failed attempt
gen_ai.operation.nameandgen_ai.provider.nameare set on every GenAI span;error.typeis set on every failed onegen_ai.usage.input_tokensandgen_ai.usage.output_tokenscome from the provider's actual response, never estimated- Opt-in content attributes (
gen_ai.input.messages,gen_ai.output.messages,gen_ai.system_instructions) are off by default and enabled only on a sampled, redacted subset - Custom concepts like tenant ID live in your own attribute namespace, never squatting on
gen_ai.* - Trace context propagates across every MCP server boundary, so a
tools/callon the client and the same call on the server share one trace ID - MCP spans carry
mcp.method.name,mcp.session.idandmcp.protocol.versionalongside thegen_ai.tool.*attributes, not instead of them - You have re-checked the GenAI and MCP semantic conventions against the current spec since your last release, because both are Development status and attribute names have already been renamed once
- Cost attribution reads real usage attributes and a maintained price table, keyed by a tenant ID set once at the root span
- Tail-based sampling keeps every error and every run past your latency budget, with
decision_waitset past your agent's real tail latency - A pipeline-level redaction processor runs regardless of what the application code remembered to do, with an explicit allow list rather than a block list
- High-cardinality identifiers (
trace_id,conversation_id,tool_call.id,user_id) never appear as metric labels; exemplars carry the trace reference instead - You can take a specific run from three days ago and answer, from telemetry alone: what it did, what it cost, and exactly where it failed
Where this leaves you
None of this is exotic. It is the same distributed tracing discipline every backend team already applies to a service mesh, pointed at the specific shape an agent produces: a tree instead of a line, a boundary crossing instead of a function call, a token count instead of a request size. The GenAI and MCP semantic conventions exist so you do not have to invent that vocabulary yourself, and their Development status is a reason to instrument carefully and watch the changelog, not a reason to wait.
Reliability, from Day 23, tells you the run should recover from a failure. Observability tells you whether it actually did, for which tenant, at what cost. Day 25 closes the loop with evaluation: once you can see a run clearly, the next question is whether it was any good, and that needs the same span tree as its raw material.
If you are running many tenants through one shared MCP surface, propagating a tenant identity and a trace context to every server your agent touches is the same problem MewCP's gateway solves for connecting the tools in the first place, just one layer further into the request.